

“The person that is buying a share of stock is convinced he knows something that the other person who’s selling it to him does not know. There’s no zero sum game in Wall Street.”
-Bernie Madoff
No doubt you’ve heard this statistic:
“Over time, the stock market averages 10% annual returns.”
The numbers vary slightly, but financial planners, stock brokers, 401k fund administrators and asset managers are all fond of quoting some version of this statistic.
Yes, the stock market, as a whole, earns about 10% a year over time. (You used to hear “10-12%” quoted, but the lack of returns over the last 12 years have squelched any references to 12%.) No doubt you’ve seen the statistic illustrated on fancy powerpoint charts and graphs. It’s a fact, more or less.
But it’s missing some inconvenient truths.
Financial professionals are not so fond of noting that real investor returns don’t match the 10% returns so often quoted. Not by a long shot. Why don’t they?
1. The average INVESTOR earns substantially less than what “the market” earns.
According to extensive quantitative analysis by Dalbar, Inc. on investor behavior, investors underperform the market – always. For the twenty years ending 12/31/2010, the S&P 500 Index averaged 9.14% a year.
However, the average equity fund investor earned a market return of only 3.83%.In 2011 alone, the average equity fund investor underperformed the S&P 500 by 7.85%
Why is this? Due to timing and psychological factors (many people sell out of fear when the market is low, and buy out of greed after the market has been climbing) gains are high) and more, the average investor significantly underperforms the market. (Apparently, it’s the one “sure thing” about the market.)
The stock market is not set up to give all investors a 10% gain. It just doesn’t work that way.
2. Volatility is increasing.
Do you notice anything “odd” about this chart showing a 62-year history of the S & P 500 from Yahoo! Finance?
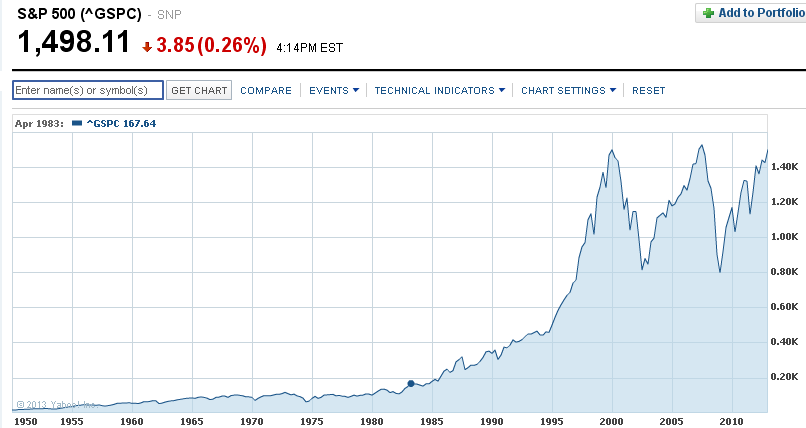
Notice the nice, steady gains from 1950 to 1960. From 1960 to 1970. From 1970 to 1980, and from 1980 t0 1990. Now, notice the incredible gains from 1990 to 2000, (representing the dot.com bubble.) You’ll see the dot.com bubble burst following, then another, even more sudden dive in 2008 in the wake of the subprime crisis.
Yes, there are “logical explanations” for the dips. But notice that the S&P 500 has truly showed no real gains in TWELVE YEARS. That’s a long slump, and we should not be surprised to learn that many of the wealthy are pulling money out of stocks (or, at least, slowing or halting new investments in the markets).
We expect more volatility to come… and more explanations. The stock market will continue to suffer the effects of de-regulation, derivatives, speed-trading technology, runaway Wall Street bonuses and other factors. The fact is that the stock market just isn’t what it used to be.
3. Actual returns are very different from often-quoted average returns.
In a nutshell, actual rate of returns track the actual profits or losses, while average rates of return average together the percentages gained or lost. The problem with that? Average and actual are not the same. If you lose 50% one year and gain 50% the next, you don’t end up at your starting point, in spite of the 0% average rate of return. Instead you’re in a hole with a 25% loss. (And increased volatility only widens the discrepancy between actual and average rates of return.)
“Average rates of return” can be tremendously misleading. See our explanation of average vs. actual returns along with illustrated examples in “The Truth about Stock Market Rates of Return.” “Average rates of return” provide a way for financial analysts to hide the truth about poor performance. Don’t fall for it.
4. Fees almost guarantee under-performing investments.
Rarely do financial planners reveal how your investments would fare with and without and the fees. Here’s where compounding interest works against you, turning a 2% annual fee into a shocking 50% loss of profits, as any online investing calculator can prove.
Take $100,000 and invest it for 30 years at a 8% rate of return and you’ll end up with just over a million dollars: $1,006,266. But add a 2% annual fee into the mix, and the portfolio drops all the way to $548,902. Subtract the $100k you started with, and you’ll see that the 2% fee that sounded so inconsequential has deleted just over half of your profits, turning a potential $9006,266 gain into a mere $448,902.
The problem is two-fold: first, most funds fail to beat the market as a whole. Last week, we examined how darts, monkeys and cats performed against the stock-picking experts. Stock picking contests were originally inspired by Burton Malkiel’s 1973 book, A Random Walk Down Wall Street, which asserted prices have statistical properties that make future predictions all but impossible. Therefore, technical analysis is useless and random selection of funds could do just as well.
But even worse, the fees incurred by many funds almost guarantee a lower return for investors. The 2% (or even 1%) going to an asset manager stacks the deck against them, which is why most professionally managed funds lose to the passive indexes the funds are trying to beat. Unfortunately, you don’t get much more for the fees than someone to blame when your funds fail to outperform the market as a whole.
What’s an Investor to Do?
If you’ve been reading our blog, you’ll know that we advocate the use of alternative investments that avoid exposure to stock market risk. But sometimes you simply can’t use “alternative investments,” at least, not without taking an enormous hit to free funds from a 401k or other retirement account. Or you may simply desire to have some assets in the stock market while you’re young and daring. You can still limit some risk with the following strategies.
Diversify holdings with broad-based index funds. Use Index funds that provide broad market exposure with low operating expenses. Look for funds constructed to track or match the components of a broad market index such as the Standard and Poor’s 500, the Russell 2000 (small companies), the DJ Wilshire 5000 (total stock market), or the MSCI EAFE (foreign stocks in Europe, Australasia, Far East).
Lower fees and raise results by avoiding “proprietary” funds. Proprietary funds are sponsored by the firms that sell them, and they are more profitable for the firm than selling third-party funds. Typically the name of the sponsoring institution is in the name of the fund, such as JPMorgan Mid Cap Core A, Goldman Sachs Korea Equity A, and Morgan Stanley European Equity B.
Avoid such funds if possible. Not only do they sport typically higher costs, they tend to underperform and they lack transferability.
If you can’t afford to lose, don’t play. Investors in or nearing retirement with all their eggs in the stock market basket were notoriously setback by the losses of 2008, many delaying retirement or taking up post-retirement jobs.
Evaluate whether or not it’s worth the risk at any given time to have your funds exposed to market risk. While putting your accounts in cash (savings account or certificates of deposit) will squash any upside potential, sometimes the best strategy is to simply leave the casino with your wallet intact.
Protect yourself. A tool that we have found helpful and effective in evaluating the relative “safety” of the market is a tool called the Penumbra Signal, which is part of Penumbra Solutions’s Mutual Fund Analyzer. If you have a significant amount of money in mutual funds, this could be very worthwhile to help protect yourself from stock market failure and risk.
Is there a better way to build wealth? Next week, we’ll look at some alternative investment vehicles outside of the stock market. Until then, we recommend getting a copy of Busting the Retirement Lies to learn more about the inconvenient truths you won’t hear from most financial professionals.
©Prosperity Economics Movement